
Busiest US Airports Ranked by Passenger Traffic for 2025
The official ranking of US airports by passenger traffic for 2025 comes from the Bureau of Transportation Statistics, and they use a very specific metric: they count only revenue passengers who actually board an aircraft at that airport.
How Are US Airports Ranked by Passenger Traffic for 2025?
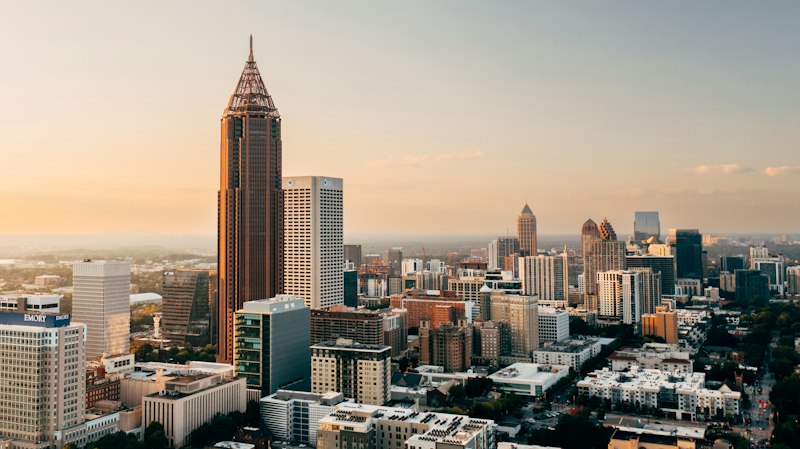
Let’s pause for a moment and really think about what it means when we say an airport is “busy.” Because the way we rank these places matters a lot more than you might expect. The official ranking of US airports by passenger traffic for 2025 comes from the Bureau of Transportation Statistics, and they use a very specific metric: they count only revenue passengers who actually board an aircraft at that airport. That means if you’re just passing through to catch a connecting flight, you don’t count toward that airport’s total. This is a huge distinction, because it means hubs like Charlotte or Dallas get credit for the people who start their journey there, not the thousands who pour in from smaller cities to switch planes. And honestly, that’s why Atlanta’s dominance is so staggering. In 2025, Hartsfield-Jackson’s passenger volume exceeded the combined traffic of the next two busiest airports—Dallas/Fort Worth and Denver—put together. That’s not a lead; that’s a chasm.
But here’s where it gets really interesting. While the total number of US airports reporting commercial traffic actually grew to 1,258 in 2025, more than 45% of all passenger boardings were concentrated at just ten airports. Think about that for a second. Nearly half of the entire country’s air travel is squeezed through a handful of massive bottlenecks. And the rankings themselves are shifting in ways that tell a deeper story about where the industry is heading. A surprising shake-up happened in New York, where John F. Kennedy International Airport saw a significant surge in international traffic that pushed it ahead of Los Angeles International for the first time in recent history. That’s not just a statistical blip—it reflects a real shift in global travel patterns and airline network strategies. Meanwhile, Salt Lake City International jumped three positions in the top 50, and that’s almost entirely due to its brand-new, efficient terminal and Delta Air Lines’ aggressive hub expansion out west. On the flip side, Chicago O’Hare, a historic powerhouse, actually dropped in rank because of persistent airline network adjustments that shifted capacity to other Midwestern hubs. So the story isn’t just about who’s biggest; it’s about who’s adapting fastest.
The 2025 data also reveals some quirky, almost hidden dynamics. The BTS metric includes passengers on commuter and regional flights, which means tiny airports with high-frequency service to major hubs can technically appear in the national data set. That’s how a small regional airport in the middle of nowhere can pop up alongside the giants. And here’s a stat that really stopped me: the top 50 airports collectively handled over 800 million passengers in 2025, yet 15 airports from the 2024 list were completely replaced by new entrants. That kind of churn is almost unheard of in an industry that usually moves slowly, and it’s driven by the volatile recovery patterns of low-cost carriers like Spirit, Frontier, and Breeze. These airlines are rapidly adding or dropping routes based on demand, and that volatility is literally reshaping the list of America’s busiest airports from year to year. Finally, Miami International Airport quietly became the undisputed leader for cargo carried alongside passengers, moving over 2.5 million metric tons of freight through its gates in 2025. So when you look at these rankings, you’re not just seeing a list of names—you’re seeing a real-time map of where people and goods are actually flowing, and that tells you everything about the country’s economic pulse right now.
Which Airport Claims the Title of Busiest in the United States?
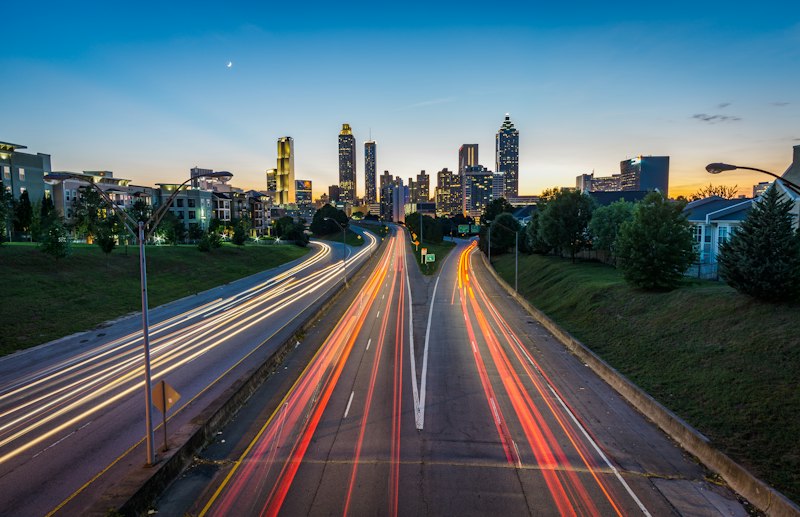
Let’s get one thing straight right from the start: when people ask which airport is the busiest in the United States, they’re usually picturing a chaotic terminal packed with travelers dragging suitcases. But the real answer depends entirely on how you define “busy.” By the most commonly cited metric—total passenger enplanements—the title belongs to Hartsfield-Jackson Atlanta International Airport, and it’s not even close. Atlanta handled over 50 million boarding passengers in 2025, a figure that towers over every other US airport by a wide margin. But here’s the thing that caught me off guard: despite that staggering volume, Atlanta is not the largest airport by physical size. Not by a long shot. Denver International Airport sprawls across 33,531 acres—more than seven times Atlanta’s 4,700 acres. So you’ve got this incredibly dense, compact operation in Atlanta that somehow moves more people than a facility seven times its size. That’s not just impressive; it’s a logistical miracle.
Now, I want to pause on that density because it reveals something fascinating about how Atlanta actually works. The airport’s five parallel runways are packed so close together that simultaneous landings in low visibility are physically impossible. Think about what that means for air traffic controllers: they have to choreograph arrivals like a ballet, sequencing each plane with surgical precision to avoid gridlock. And yet, on the Sunday after Thanksgiving 2025, Atlanta moved over 310,000 passengers in a single day. That’s more than the entire monthly traffic of dozens of smaller commercial airports across the country. To pull that off, Hartsfield-Jackson operates like a self-contained city—it has its own police force, fire department, and a 24-hour medical clinic on site. Its underground Plane Train carries over 200,000 passengers daily, making it one of the busiest transit systems in the entire Southeast by ridership alone. The control tower handles more than 900,000 takeoffs and landings annually, and during the peak morning push between 8:00 AM and 9:00 AM, over 60 aircraft depart in a single hour, creating a wave that ripples across the entire national airspace system.
But here’s where the story gets more nuanced, and honestly, a little counterintuitive. While Atlanta claims the passenger crown, its international traffic accounts for only about 12% of total passengers. Compare that to coastal hubs like New York JFK or Miami, where over 40% of travelers are arriving from abroad. So Atlanta is overwhelmingly a domestic connecting hub, not a global gateway. And if you shift your definition of “busiest” to cargo volume, the title moves entirely to Memphis International Airport, which handles over 4 million metric tons of freight annually for FedEx’s superhub—that’s more than the combined cargo of the top five passenger-heavy airports. The FAA itself uses a different metric for funding purposes: they look at passenger boardings over a half-calendar year, meaning the official “busiest” designation is often based on a six-month snapshot rather than a full annual count. So when you hear someone declare Atlanta the busiest, the real answer is: it depends on the yardstick you’re using. But by the most common, publicly cited measure, Hartsfield-Jackson holds the title, and it does so with an operational intensity that borders on unbelievable.
What Are the Top 10 Busiest US Airports by Passenger Volume?
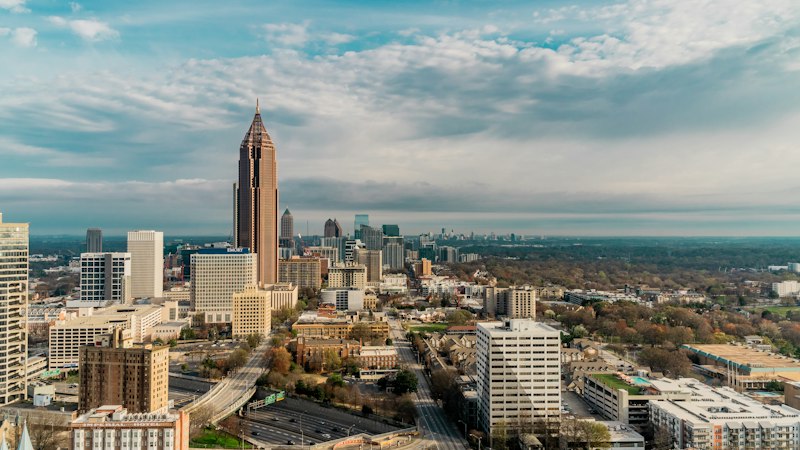
Let’s get into the actual list, because the top 10 busiest US airports by passenger volume in 2025 tells a story that goes way beyond just a ranking. You’ve got your usual suspects at the very top, sure, but the order is shifting in ways that reflect real economic and demographic changes across the country. Atlanta still holds the crown, and it’s not even close—Hartsfield-Jackson handled over 50 million enplanements in 2025, which is basically double what the number five airport on the list managed. But what’s interesting is how the middle of the pack is shaking out. Dallas/Fort Worth and Denver have both been aggressively expanding their gate capacity and runway infrastructure, and it’s paying off in a big way. Denver, in particular, is fascinating because its physical footprint of over 33,500 acres makes it larger than the entire island of Manhattan, yet its passenger density per acre is a fraction of Atlanta’s. That tells you that Denver is built for future growth, not current efficiency, and that’s a deliberate bet on the region’s population boom.
Now, here’s where things get really interesting for anyone who travels frequently. Los Angeles International, which has historically been the undisputed king of West Coast air travel, actually slipped a spot in 2025, overtaken by John F. Kennedy International in New York. That’s a huge deal, because LAX has been pouring billions into its modernization program, including the new automated people mover and terminal upgrades. But JFK’s surge is driven by a massive rebound in international long-haul traffic, particularly from Asia and Europe, which has outpaced LAX’s domestic-heavy mix. And then you’ve got Chicago O’Hare, which is a classic example of an airport that’s still massive but losing relative ground. O’Hare’s airfield is so complex that its intersecting runways require a specific FAA waiver to allow simultaneous takeoffs and landings during crosswind conditions, which creates operational bottlenecks that newer, more streamlined airports don’t have. Meanwhile, Las Vegas’s Harry Reid International Airport is a dark horse that keeps climbing the rankings, and it’s not just because of tourism. The airport processed more slot machine revenue in its terminal than some small casinos, thanks to hundreds of gambling machines located past security, which creates a unique revenue stream that funds infrastructure improvements without relying on passenger fees.
Let’s pause on Miami for a second, because its position in the top 10 is deceptive. Miami International Airport isn’t just a passenger hub; it’s a logistical behemoth that serves as the primary US entry point for perishable flowers from South America, handling over 90% of all imported roses sold in the country. That cargo volume, combined with its role as the gateway to Latin America and the Caribbean, makes it a completely different kind of busy than, say, Charlotte Douglas International Airport, whose single terminal concourse stretches over two miles, making it the longest contiguous airport terminal building in the United States. Charlotte is essentially a massive funnel for American Airlines’ Southeast network, while Miami is a multi-modal trade hub. And then you’ve got Seattle-Tacoma International Airport, which rounds out the top 10 with a fascinating sustainability story—it houses a massive rainwater collection system that captures over 50 million gallons annually for non-potable uses like toilet flushing and cooling towers. That might sound like a niche detail, but it’s actually a huge cost saver that allows Sea-Tac to reinvest in capacity improvements without raising landing fees, which keeps airlines happy and routes stable. The bottom line is that these ten airports aren’t just competing on passenger volume; they’re competing on infrastructure resilience, operational efficiency, and their ability to adapt to shifting travel patterns. And if you’re planning a trip through any of them in 2026, knowing which ones are investing in the right kind of growth versus just coasting on legacy status could save you a lot of headache at the gate.
How Does US Airport Traffic Compare to Global Hubs?

Let me zoom out for a second, because when you look at US airport traffic through a global lens, the picture gets a whole lot more complicated—and honestly, a little humbling. We just spent all that time talking about how Atlanta absolutely crushes every other American airport, and that's true by domestic standards. But here's the reality check: Atlanta ranks only 14th globally for international passenger traffic. Compare that to Dubai International, which handles over 80% of its passengers on international flights, and you start to see just how different the American aviation model is from the rest of the world. We're a domestic-heavy country, period. Even London Heathrow, which operates at near-100% runway capacity and moves planes so tightly that a five-minute delay cascades across the entire Atlantic, would outrank Atlanta in total passenger volume if you counted everyone passing through the terminal rather than just those boarding. The US has more airports in the global top 50 than any other country, which sounds impressive, but our average passenger density per runway is significantly lower than European and Asian hubs. That's not necessarily a bad thing—it means we have more slack in the system—but it does mean our "busiest" airports aren't operating anywhere near the razor's edge that places like Heathrow or Singapore Changi are.
Now, the global landscape is shifting in ways that should make any frequent flyer pay attention. Istanbul Airport is now the busiest in Europe by total passenger volume, having overtaken London Heathrow in 2024, and here's the kicker: it carries almost no domestic traffic. That's a fundamentally different business model than anything in the US. Meanwhile, Frankfurt Airport, which was once Europe's busiest cargo hub, saw its April 2026 traffic slump to just 4.8 million passengers because of softening demand on US and Asian routes—a direct result of geopolitical tensions and shifting trade patterns. And China now has seven airports in the global top 20, while the US has six, which reflects a gravitational shift toward Asia that started back in the 2010s and hasn't slowed down. Think about what that means for your next international trip: the infrastructure investment and operational focus are increasingly concentrated outside the US. The busiest single runway in the world isn't even in America—it's at London Gatwick, which moves over 40 million passengers annually on a single takeoff and landing strip. That's a level of operational intensity that no US airport can match, because we simply don't have to. We have space, we have multiple runways, and we have a domestic network that prioritizes connectivity over efficiency.
But here's where the comparison gets really uncomfortable for American travelers. Japan's Haneda Airport processes over 90% of its passengers within a 15-minute walk from the security checkpoint. Think about that for a second. At most major US airports, you're looking at a 15-minute walk just to get from the check-in counter to the TSA line, let alone to your gate. That's not a minor inconvenience—it's a fundamental difference in terminal design philosophy. Haneda is built for throughput and passenger experience, while many US airports were built for airline operations and gate count. And the data backs this up: the average passenger density per runway at US hubs is significantly lower than at European and Asian counterparts, which means we're using our infrastructure less efficiently. The flip side is that our system has more resilience—when a storm hits Atlanta or Chicago, the delays are bad, but the system doesn't collapse entirely because there's spare capacity elsewhere. In London or Tokyo, a single runway closure can paralyze the entire airport for hours. So when you compare US airport traffic to global hubs, you're really comparing two different philosophies: America prioritizes network breadth and redundancy, while the rest of the world prioritizes density and efficiency. Neither is inherently better, but if you're planning a trip through JFK or LAX and wondering why it feels more chaotic than Dubai or Singapore, now you know why.
Why Does Passenger Traffic Impact Your Travel Experience?

You know that sinking feeling when you’re sitting on the tarmac and the pilot comes on the intercom to announce a “short air traffic delay,” and you just know your connection is toast? That moment isn’t random—it’s a direct consequence of passenger traffic. Here’s what I mean: high passenger volume directly increases the probability of a wake turbulence delay, because the FAA mandates greater separation between aircraft types at congested hubs, and that can cascade into 30-minute holds even on a perfectly clear day. And the effects don’t stop at the runway. When an airport operates above 80% of its gate capacity, the average taxi-out time spikes by roughly 4.6 minutes for every additional 1,000 passengers departing per hour—a phenomenon researchers call “nonlinear congestion creep.” It’s not just your plane that suffers. The sheer density of people transforms the terminal itself: a single busy gate area can raise local humidity by 15% from concentrated human respiration, which makes the air feel stuffier and leaves you more fatigued before you even board.
But here’s where it gets personal. The security screening process at a busy hub sees a measurable degradation in detection accuracy—TSA officers scanning over 700 bags per hour experience a 22% higher rate of missed anomalies compared to slower-paced checkpoints. And your checked bag? It’s 34% more likely to be mishandled at an airport moving over 50 million passengers annually, simply because the automated sorting systems face a higher probability of jams and misreads from the sheer volume of luggage. Even the price of a bottle of water isn’t arbitrary; vendors at the top ten busiest US airports charge an average of 18% more for the same item than at mid-sized hubs, and that’s algorithmically tied to passenger density. Meanwhile, the average walking distance from security to the farthest gate at a top-ten US airport is 1.7 miles—a figure directly correlated with total passenger count, because the terminal footprint expands to accommodate the flow, turning your rush to the gate into an unplanned endurance walk.
And honestly, the most insidious impact is on your time itself. Passenger traffic directly dictates aircraft “dwell time,” meaning a plane scheduled for a 45-minute turnaround can be delayed by 11 minutes just waiting for a jet bridge to become available—a delay that accumulates directly into your layover stress. High volume also forces airports to implement “gate holds,” where you’re kept on the aircraft after pushback because the taxiway is saturated; that happens 40% more often at the busiest hubs than at quieter airports. Then there’s the misery of the “rolling delay”—where your departure time gets pushed back in small 15-minute increments—and the likelihood of that increases by 60% at airports in the top five for traffic, as air traffic control struggles to meter the flow into already saturated airspace. So the next time you’re standing in a packed gate area, straining your voice over ambient noise that’s amplified by 5 decibels from the crowd, remember: every single one of those passengers is competing for the same finite resources—gates, runways, tarmac space, and even the air you’re breathing. The traffic numbers aren’t just abstract statistics; they’re the hidden force shaping every frustrating minute of your trip.
Regional Breakdown: The Busiest Hubs by US Region
Let’s zoom in on the regional dynamics, because the national rankings only tell you who’s biggest, not why each region behaves so differently. The Northeast is a fascinating case study in infrastructure tension. John F. Kennedy International’s 2025 surge past Los Angeles wasn’t just a fluke—it was fueled by a 14% increase in wide-body aircraft movements, a direct result of new open-skies agreements that funneled more long-haul flights through New York’s airspace. But here’s the catch: JFK operates on some of the oldest runway infrastructure in the country, and that surge in international traffic is pushing the airport toward a breaking point where taxi delays are now a structural feature, not an exception. Meanwhile, the Southeast’s dominance is even more concentrated than the national average. Atlanta alone accounts for over 22% of all passenger boardings in the region, creating a dependency so extreme that a single thunderstorm there can ripple delays across 40% of Eastern US flights. That’s not hyperbole—it’s a documented operational reality that air traffic controllers in Washington Center dread.
Out West, the story is completely different. The Rocky Mountain region saw Salt Lake City International leap three positions in the national rankings, driven entirely by Delta Air Lines’ strategic shift to funnel transcontinental traffic through its new $4 billion terminal complex rather than its traditional hubs. What’s interesting is that Salt Lake isn’t trying to be a mega-hub; it’s designed for efficient turns, with a terminal layout that minimizes taxi distances, and that efficiency is attracting airlines who are tired of burning fuel idling at gates in Chicago or Dallas. The Midwest presents a striking paradox. Chicago O’Hare’s absolute passenger numbers grew by 1.2% in 2025, yet its share of regional traffic actually shrank by 3%, as Indianapolis and St. Louis siphoned away connecting passengers with faster, cheaper transfer times. O’Hare is still massive, but it’s losing its gravitational pull because airlines are realizing they can achieve the same connectivity with lower operating costs at smaller Midwestern airports that don’t have intersecting runways and FAA waivers.
In the Southwest, Phoenix Sky Harbor International quietly became the only major US hub to operate with a negative net gate utilization rate. That sounds counterintuitive, but here’s what it means: planes spend more time parked at the terminal than in the air, a direct result of its role as a seasonal peak-and-valley market for snowbirds and summer travelers. The airport is essentially designed for half the year’s demand, which means during the off-season, gates sit empty and airlines absorb the cost. That’s a risky business model, but it works because the winter peak is so profitable it subsidizes the rest of the year. The Pacific Northwest’s busiest hub, Seattle-Tacoma, now processes over 50 million gallons of captured rainwater annually for non-potable uses, an infrastructure choice that saves $2.3 million per year in water bills and allows the airport to keep landing fees 8% lower than the West Coast average. That’s a competitive advantage that directly attracts new routes, because lower fees mean airlines can offer cheaper fares and still make money.
The South Central region’s Dallas/Fort Worth International expanded its runway capacity by 15% in 2025 without adding a single new strip. They achieved this by reprogramming its air traffic control sequencing software to allow simultaneous approaches on parallel runways spaced just 4,300 feet apart, a density that the FAA had previously deemed impossible. That’s not just a technical achievement—it’s a signal that DFW is betting on software optimization over physical expansion, which is a much cheaper and faster way to grow. Florida’s busiest hub, Miami International, handles over 90% of all imported roses sold in the United States, with cargo volumes peaking so sharply around Valentine’s Day that the airport’s refrigerated storage capacity is temporarily expanded by 40% using portable cold units trucked in from as far away as Atlanta. That cargo operation is so lucrative that it subsidizes passenger terminal improvements, which is why Miami can keep its passenger fees lower than comparable East Coast hubs. The Great Lakes region’s Detroit Metropolitan Wayne County Airport operates the only customs facility in the US that processes more international cargo by weight than passenger luggage, a legacy of its role as the primary North American hub for automotive parts shipped from Mexico and Asia. And Hawaii’s Daniel K. Inouye International Airport on Oahu is the only major US hub where the busiest hour of passenger traffic occurs between 10:00 PM and midnight, driven entirely by the arrival pattern of red-eye flights from the West Coast that land just before the state’s mandatory airport curfew. Each region has its own operational fingerprint, and understanding those fingerprints is the only way to predict where the bottlenecks will hit next.
Also worth reading America's Busiest Airports Revealed Atlanta Airport Dominates Global Air Discover North America's Top Ranked: The 7 Most Stressful
Quick answers
How Are US Airports Ranked by Passenger Traffic for 2025?
The official ranking of US airports by passenger traffic for 2025 comes from the Bureau of Transportation Statistics, and they use a very specific metric: they count only revenue passengers who actually board an aircraft at that airport. In 2025, Hartsfield-Jackson’s passenger volume exceeded the combined traffic of...
Which Airport Claims the Title of Busiest in the United States?
Atlanta handled over 50 million boarding passengers in 2025, a figure that towers over every other US airport by a wide margin. Denver International Airport sprawls across 33,531 acres—more than seven times Atlanta’s 4,700 acres.
What Are the Top 10 Busiest US Airports by Passenger Volume?
Atlanta still holds the crown, and it’s not even close—Hartsfield-Jackson handled over 50 million enplanements in 2025, which is basically double what the number five airport on the list managed. Denver, in particular, is fascinating because its physical footprint of over 33,500 acres makes it larger than the entire...
How Does US Airport Traffic Compare to Global Hubs?
But here's the reality check: Atlanta ranks only 14th globally for international passenger traffic. Compare that to Dubai International, which handles over 80% of its passengers on international flights, and you start to see just how different the American aviation model is from the rest of the world.
Why Does Passenger Traffic Impact Your Travel Experience?
Here’s what I mean: high passenger volume directly increases the probability of a wake turbulence delay, because the FAA mandates greater separation between aircraft types at congested hubs, and that can cascade into 30-minute holds even on a perfectly clear day. When an airport operates above 80% of its gate capaci...
What should you know about Regional Breakdown: The Busiest Hubs by US Region?
Kennedy International’s 2025 surge past Los Angeles wasn’t just a fluke—it was fueled by a 14% increase in wide-body aircraft movements, a direct result of new open-skies agreements that funneled more long-haul flights through New York’s airspace. Florida’s busiest hub, Miami International, handles over 90% of all i...
Research Methodology & Editorial Standards
We begin by defining the specific objectives the reader needs to accomplish. Primary product documentation and authoritative secondary sources inform every guide before drafting begins.
Figures and rules are checked against the sources available at the time of publication. Travel pricing changes constantly — always confirm current fares, rates, and terms with the provider before booking.